Fact Book 2026 (82KB)
Performance by Business Segment (Consolidated)
Business Summary
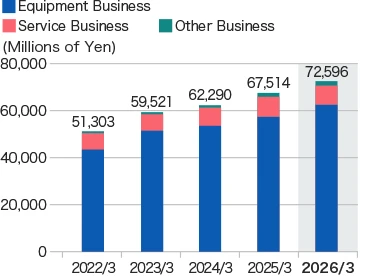
Orders-received
(Millions of Yen)
Please scroll horizontally to look at table below.
| |
2022/3 |
2023/3 |
2024/3 |
2025/3 |
2026/3 |
| Equipment Business |
43,535 |
51,446 |
53,565 |
57,283 |
62,216 |
| Service Business |
6,771 |
6,963 |
7,634 |
8,532 |
8,294 |
| Other Business |
1,265 |
1,469 |
1,453 |
2,170 |
2,529 |
| Elimination of intersegment revenues |
-269 |
-359 |
-363 |
-472 |
-442 |
| Total |
51,303 |
59,521 |
62,290 |
67,514 |
72,596 |
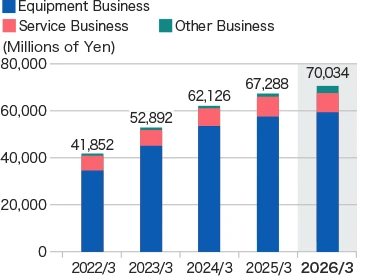
Net sales
(Millions of Yen)
Please scroll horizontally to look at table below.
| |
2022/3 |
2023/3 |
2024/3 |
2025/3 |
2026/3 |
| Equipment Business |
34,518 |
45,031 |
53,518 |
57,507 |
59,468 |
| Service Business |
6,407 |
6,788 |
7,536 |
8,425 |
8,327 |
| Other Business |
1,188 |
1,404 |
1,455 |
1,758 |
2,747 |
| Elimination of intersegment revenues |
-261 |
-330 |
-383 |
-403 |
-507 |
| Total |
41,852 |
52,892 |
62,126 |
67,288 |
70,034 |
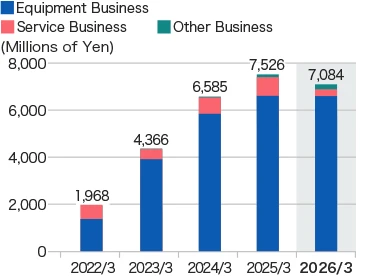
Operating profit
(Millions of Yen)
Please scroll horizontally to look at table below.
| |
2022/3 |
2023/3 |
2024/3 |
2025/3 |
2026/3 |
| Equipment Business |
1,370 |
3,919 |
5,848 |
6,610 |
6,606 |
| Service Business |
618 |
428 |
681 |
793 |
228 |
| Other Business |
-23 |
16 |
51 |
126 |
239 |
| Elimination of intersegment revenues |
2 |
1 |
3 |
-4 |
10 |
| Total |
1,968 |
4,366 |
6,585 |
7,526 |
7,084 |
-
Orders-received
-
Net sales
-
Operating profit
Sales by Region (Consolidated)
(Millions of Yen)
Please scroll horizontally to look at table below.
| |
2022/3 |
2023/3 |
2024/3 |
2025/3 |
2026/3 |
| Japan |
20,771 |
25,008 |
29,162 |
32,334 |
34,359 |
| Republic of Korea |
1,556 |
2,075 |
2,630 |
2,959 |
2,341 |
| Taiwan |
758 |
841 |
1,079 |
1,136 |
1,460 |
| China |
9,083 |
11,858 |
12,176 |
11,699 |
12,028 |
| Southeast Asia & India |
2,582 |
3,172 |
3,359 |
3,975 |
4,833 |
| Europe & North America |
6,662 |
9,568 |
12,911 |
- |
- |
| North America |
- |
- |
- |
11,187 |
12,754 |
| Europe |
- |
- |
- |
2,919 |
1,696 |
| Others |
437 |
367 |
807 |
1,074 |
560 |
| Total |
41,852 |
52,892 |
62,126 |
67,288 |
70,034 |
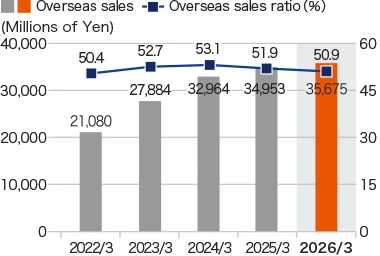
Overseas sales (Consolidated)
Overseas sales・Overseas sales ratio
Please scroll horizontally to look at table below.
| |
2022/3 |
2023/3 |
2024/3 |
2025/3 |
2026/3 |
| Overseas sales |
(Millions
of Yen) |
21,080 |
27,884 |
32,964 |
34,953 |
35,675 |
| Overseas sales ratio |
(%) |
50.4 |
52.7 |
53.1 |
51.9 |
50.9 |
Overseas sales・Overseas sales ratio