


Financial Indicators
Financial Indicators (Consolidated)
Please scroll horizontally to look at table below.
-
Return on equity
Return on assets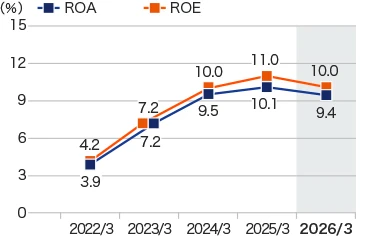
-
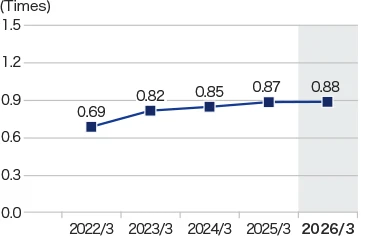
Total assets turnover
-
Current ratio
Quick assets to current liabilities ratio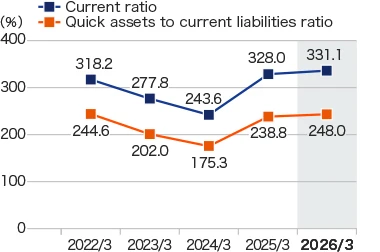
-
Equity-to-asset ratio
Fixed assets ratio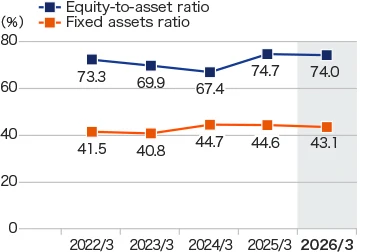
Latest Materials
-
Download
All DataZIP 5.7MB
-
Preliminary Results
(FY2025) -
Presentation Materials
(FY2025) Presentation Materials Reference
- Fact Book 2026
- ESG Data 2025