


Financial Highlights
During fiscal 2025, the year ended March 31, 2026, the ESPEC Group’s business environment saw firm demand for testing electronics components and electronics equipment, particularly in Japan, Southeast Asia, and Taiwan, in the AI semiconductor sector, which is a target market under the medium-term management plan. In the satellite communications sector, testing demand from private companies operating low-Earth orbit satellites in North America has grown significantly. In the automotive-related field, testing demand has significantly decreased, particularly for EVs and batteries.
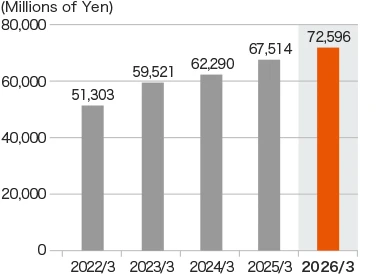
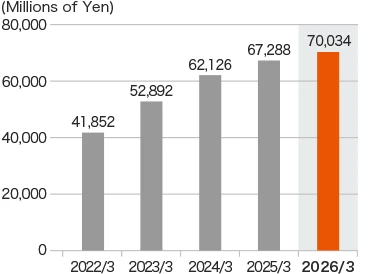
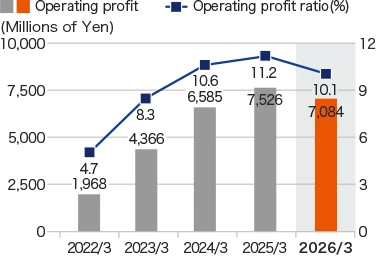
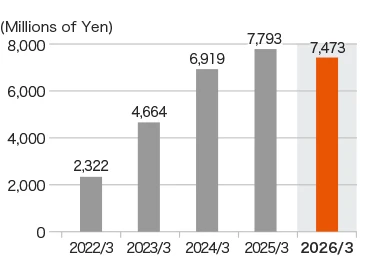
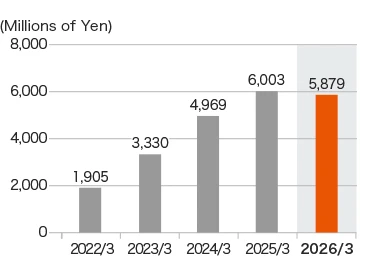
Looking at the Company’s operating results for fiscal 2025, orders received increased 7.5% year on year to ¥72,596 million mainly due to strong order trends in North America and Southeast Asia. Net sales increased 4.1% year on year to ¥70,034 million mainly due to strong sales in Japan, North America and Southeast Asia. Both orders received and net sales reached new record highs. On the profit front, operating profit was ¥7,084 million, a year-on-year decrease of 5.9%, mainly due to an increase in selling, general and administrative expenses associated with an increase in orders received, as well as a deterioration in profitability in the Chinese market and laboratory testing services, despite improved profitability in customized products. Profit attributable to owners of parent decreased by 2.1% year on year to ¥5,879 million. In addition, return on equity (ROE) stood at 10.0%.
Financial Highlights (Consolidated)
Please scroll horizontally to look at table below.
-
Orders-received
-
Net sales
-
Operating profit
-
Ordinary profit
-
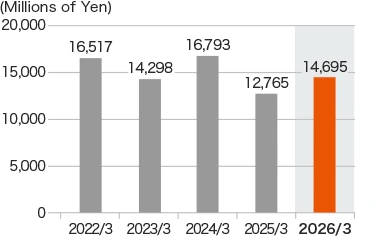
Profit attributable to owners of parent
-
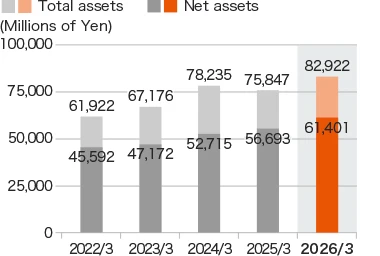
Total assets / Net assets
-
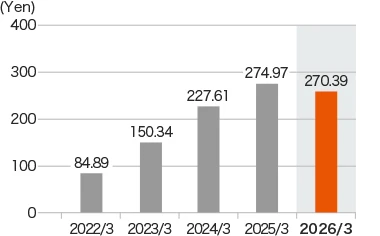
Earnings per share
-
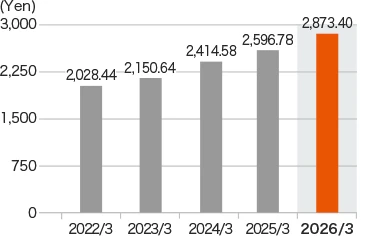
Book value per share
-
Return on assets
Return on equity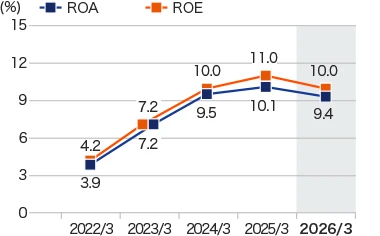
-
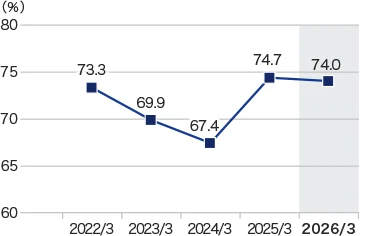
Equity-to-asset ratio
-
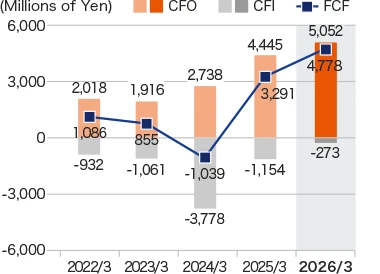
CFO・CFI・FCF
-
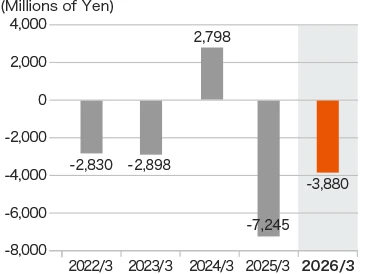
CFF
-
Cash and cash equivalents at end of period
Latest Materials
-
Download
All DataZIP 5.7MB
-
Preliminary Results
(FY2025) -
Presentation Materials
(FY2025) Presentation Materials Reference
- Fact Book 2026
- ESG Data 2025