


Investment Returns
Investment Returns (Consolidated)
Please scroll horizontally to look at table below.
-
Price to earnings ratio
Price to book value ratio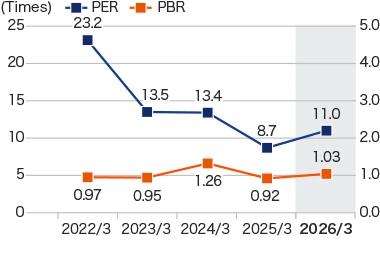
-
Cash dividends per share
Dividend payout ratio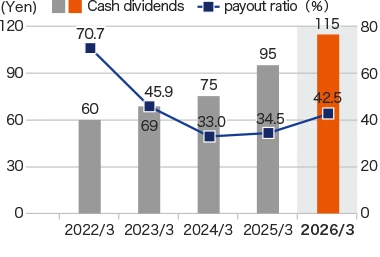
-
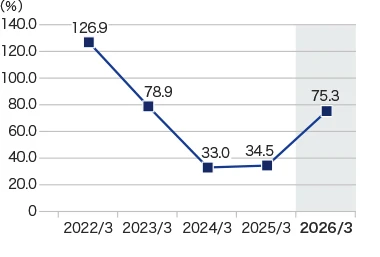
Total payout ratio
-
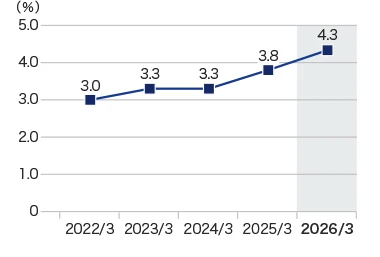
Ratio of dividends of net assets(DOE)
-
Total market value
Number of shares outstanding
(Excluding treasury stock)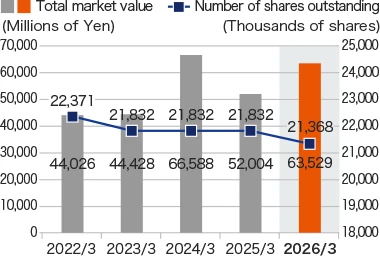
Latest Materials
-
Download
All DataZIP 5.7MB
-
Preliminary Results
(FY2025) -
Presentation Materials
(FY2025) Presentation Materials Reference
- Fact Book 2026
- ESG Data 2025