


ESG Data
- ESG Data 2025 (45KB)
- Annual Environmental Data by Fiscal Year(PRTR results, Business Activities Material Balance, Site Specific Data) (106KB)
Environmental
- Greenhouse Gas Emissions (Consolidated)
- Energy Consumption (Consolidated)
- Breakdown of Electricity Consumption (Consolidated)
- Water Withdrawal (Consolidated)
- Total Amount of Discharge (Non-consolidated)
- Fluorocarbon Recovery (Non-consolidated)
- Product Recycling Service (Non-consolidated)
- Environmental Data
- FY 2024 PRTR results
- FY 2024 Business Activities Material Balance
- FY 2024 Site Specific Data
■Greenhouse Gas Emissions (Consolidated)*1
Greenhouse Gas Emissions Report (Independent Third Party Assurance Report)
Please scroll horizontally to look at table below.
- *1 The figures for each item are based on an independent third-party assurance report.
- *2 For the fiscal year ended March 2024, COSMOPIA HIGHTECH CORP., which became a consolidated subsidiary in August 2023, is excluded.
■Energy Consumption (Consolidated)
Please scroll horizontally to look at table below.
- * For the fiscal year ended March 2024, COSMOPIA HIGHTECH CORP., which became a consolidated subsidiary in August 2023, is excluded.
■Breakdown of Electricity Consumption (Consolidated)
Please scroll horizontally to look at table below.
- * For the fiscal year ended March 2024, COSMOPIA HIGHTECH CORP., which became a consolidated subsidiary in August 2023, is excluded.
■Water Withdrawal (Consolidated)
Please scroll horizontally to look at table below.
- * For the fiscal year ended March 2024, COSMOPIA HIGHTECH CORP., which became a consolidated subsidiary in August 2023, is excluded.
■Total Amount of Emissions (Non-consolidated)
Please scroll horizontally to look at table below.
■Fluorocarbon Recovery (Non-consolidated)
Please scroll horizontally to look at table below.
■Product Recycling Service (Non-consolidated) *
Please scroll horizontally to look at table below.
- * We have been certified under the Ministry of the Environment's Wide-Area Certification System, and we collect our used environmental testing equipment for a fee and recycle it.
■Environmental Data
Please scroll horizontally to look at table below.
- * Achievements of ESPEC MIC CORP.
FY 2024 PRTR results
Calculation range: ESPEC CORP., ESPEC Assist Corporation, ESPEC MIC Corporation,and ESPEC THERMAL TECH SYSTEM CORP.
Please scroll horizontally to look at table below.
(Units: kg)
| Name of Class 1 chemical substance | Ethyl Benzene |
Xylene | Toluene | Hexane | Benzene | Tritolyl Phosphate | Glyphosate and its ammonium, isopropylamine, potassium and sodium salt | Cyclo Hexane |
Trimethyl benzene |
Heptane | ||
|---|---|---|---|---|---|---|---|---|---|---|---|---|
| Number of Class 1 chemical substance | 53 | 80 | 300 | 392 | 400 | 460 | 605 | 629 | 691 | 731 | ||
| Amount handled annually | 1.2 | 7.7 | 47.9 | 11.8 | 1.0 | 1.6 | 2.3 | 7.8 | 6.7 | 2.2 | ||
| Contained in product (Voluntary measurement item) | - | - | - | - | - | 1.6 | - | - | - | - | ||
| Amount recycled (sold) (voluntary measurement item) | - | - | - | - | - | - | - | - | - | - | ||
| Amounts released | (A) Amount released into atmosphere annually | 1.2 | 7.7 | 47.9 | 11.8 | 1.0 | - | - | 7.8 | 6.7 | 2.2 | |
| (B) Amount released into public waters annually | - | - | - | - | - | - | - | - | - | - | ||
| (C) Amount released into soil at the business sites other than (D) | - | - | - | - | - | - | 2.3 | - | - | - | ||
| (D) Amount disposed of in landfill at the business sites | - | - | - | - | - | - | - | - | - | - | ||
| Amounts transferred | (A) Transferred to sewage | - | - | - | - | - | - | - | - | - | - | |
| (B) Other than (A) transferred to outside business sites | - | - | - | - | - | - | - | - | - | - | ||
* Of the Class 1 Designated Chemical Substances, those that have been confirmed to be handled in quantiti es of 1kg or more per year are listed above.
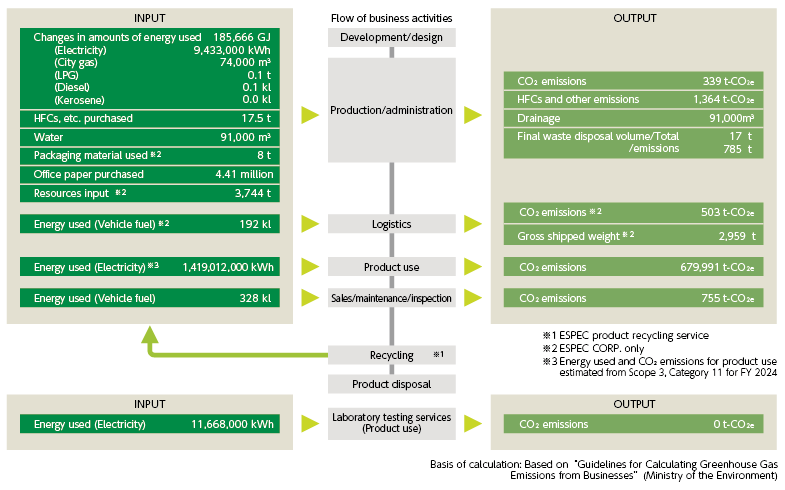
FY 2024 Business Activities Material Balance
FY 2024 Site Specific Data
Please scroll horizontally to look at table below.
| ESPEC CORP. (Incl. Neyagawa Business Center) |
Fukuchiyama Plant (Incl. ESPEC MONOZUKURI SERVICE CORP.) |
Kobe R&D Center | Utsunomiya Technocomplex | All domestic sales/service offices and testing laboratories (Toyota, Kariya,Tokoname) (18 site total) | ESPEC Assist Corporation | ESPEC MIC Corporation | ESPEC THERMAL TECH SYSTEM CORP | COSMOPIA HIGHTECH CORP | Total domestic consolidated bases | |
|---|---|---|---|---|---|---|---|---|---|---|
| Geographical area | Commercial district | Exclusive industrial zone | Semiindustrial zone | Exclusive industrial zone | - | - | - | - | - | - |
| Main businesses | Development, design and sales of environmental testing equipment, and other indirect operations, etc. | Manufacturing and design of environmental testing equipment, maintenance and inspection of rental and used equipment | Development, design, and manufacturing of environmental testing equipment, laboratory testing services, and product maintenance | Sales and maintenance of environmental testing equipment, and laboratory testing services | Sales, maintenance of environmental testing equipment, production (on-site assembly), and laboratory testing services | Sales of scientific instruments, measuring equipment, analytical instruments, environmental testing equipment, research facilities, general-purpose equipment for analysis, etc., and related services and staffing services | Environmental preservation business, agri-system business, and food technology business | Development, design, manufacturing, sales, and product maintenance of chillers, air conditioners, and environmental testing equipment | Development, design, manufacturing, and sales of environmental testing equipment | - |
| Total emissions*1*2 | 18.5t | 486.5t | 60.4t | 30.7t | 122.6t | 6.6t | 25.9t | 33.3t | - *3 | 784.5t |
| General waste | 10.8t | 15.3t | 5.3t | 1.4t | 13.7t | 4.9t | 3.2t | 13.8t | - *3 | 68.5t |
| Industrial waste | 7.6t | 94.1t | 27.2t | 29.3t | 95.6t | 1.0t | 22.7t | 17.8t | - *3 | 295.4t |
| (Landfill) | 〔0.3t〕 | 〔13.6t〕 | 〔0.0t〕 | 〔0.0t〕 | 〔2.1t〕 | 〔0.0t〕 | 〔0.6t〕 | 〔0.0t〕 | - *3 | 〔16.6t〕 |
| Valuable resources (total) | 0.0t | 377.1t | 27.9t | 0.0t | 13.4t | 0.6t | 0.0t | 1.6t | - *3 | 420.6t |
| Electricity | 434,200 kWh | 4,893,100 kWh | 4,068,900 kWh | 5,476,700 kWh | 5,304,300 kWh | 40,900 kWh | 110,500 kWh | 416,800 kWh | 418,900 kWh | 21,164,300 kWh |
| LPG usage | ‐ | ‐ | ‐ | ‐ | 0.050t | 0.016t | ‐ | ‐ | - | 0.1t |
| City gas usage | 400 ㎥ | 72,900 ㎥ | ‐ | ‐ | ‐ | ‐ | ‐ | ‐ | 1,200 ㎥ | 74,500 ㎥ |
| Office paper (Number of A4-equivalent sheets) | 118.1 million sheets | 150.9 million sheets | 39.4 million sheets | 5.1 million sheets | 60.5 million sheets | 12.3 million sheets | 17.0 million sheets | 18.8 million sheets | 18.7 million sheets | 440.6 million sheets |
| Water | 1.9,000㎥ | 21.7,000㎥ | 10.3,000㎥ | 5.2,000㎥ | 8.8,000㎥ | 0.2,000㎥ | 29.5,000㎥ | 1.7,000㎥ | 12.000㎥ | 91.2,000㎥ |
| Company cars owned(total) | 6 vehicles | 6 vehicles | 21 vehicles | 14 vehicles | 152 vehicles | 19 vehicles | 19 vehicles | 17 vehicles | 2 vehicles | 256 vehicles |
| (Eco-friendly cars) | (5 vehicles) | (4 vehicles) | (3 vehicles) | (9 vehicles) | (58 vehicles) | (1 vehicles) | (10 vehicles) | (6 vehicles) | (0 vehicles) | (96 vehicles) |
| Gasoline | 5.8kℓ | 4.0kℓ | 26.5kℓ | 13.8kℓ | 183.0kℓ | 29.4kℓ | 20.9kℓ | 27.6kℓ | 2.4kℓ | 313.5kℓ |
| Diesel fuel | ‐ | ‐ | 2.4kℓ | ‐ | 11.8kℓ | ‐ | ‐ | ‐ | ‐ | 14.2kℓ |
| Driving distance | 104,200 km | 88,600 km | 365,900 km | 203,500 km | 2,461,200 km | 385,700 km | 335,100 km | 320,100 km | 26,000 km | 4,290,400 km |
| Compliance with necessary laws (Number of significant findings) | 0 | 0 | 0 | 0 | 0 | 0 | 0 | 0 | 0 | 0 |
- *1 Total emissions = General waste + Industrial waste (including special control waste) + Valuable resources
- *2 Includes work performed at customer sites
- *3 Due to the location of the facility within the premises of the acquired company and the resulting inability to obtain data with sufficient accuracy, this information has not been reflected in the site-specific data.
Governance
- Board of Directors (Non-consolidated)
- Audit & Supervisory Board (Non-consolidated)
- Audit & Supervisory Committee (Non-consolidated)
- Voluntary Committee(s) Equivalent to Nomination Committee or Remuneration Committee (Non-consolidated)
- Compensation (Non-consolidated)
- Compliance (Non-consolidated)
■Board of Directors (Non-consolidated)
Please scroll horizontally to look at table below.
- * The Company has transitioned from a company with an Audit & Supervisory Board to a company with an Audit & Supervisory Committee in June 2022.
■Audit & Supervisory Board (Non-consolidated)
Please scroll horizontally to look at table below.
- * The Company has transitioned from a company with an Audit & Supervisory Board to a company with an Audit & Supervisory Committee in June 2022.
■Audit & Supervisory Committee (Non-consolidated)
Please scroll horizontally to look at table below.
- * The Company has transitioned from a company with an Audit & Supervisory Board to a company with an Audit & Supervisory Committee in June 2022.
■Voluntary Committee(s) Equivalent to Nomination Committee or Remuneration Committee (Non-consolidated)
Please scroll horizontally to look at table below.
- * The Company changed the name of the Personnel Advisory Committee, a voluntary body that deliberates on director appointments and compensation, to the Nomination and Compensation Advisory Committee in March 2021, and changed to the Nomination and Compensation Committee in March 2022.
■Compensation (Non-consolidated)
Please scroll horizontally to look at table below.
- * The Company has transitioned from a company with an Audit & Supervisory Board to a company with an Audit & Supervisory Committee in June 2022.
The above includes four directors (including one outside director) and four Audit & Supervisory Board members (including three outside Audit & Supervisory Board members) who retired at the conclusion of the 69th Ordinary General Meeting ofShareholders as their terms of office hadended. Of these, three Audit & Supervisory Board members (including two outside Audit & Supervisory Board members) were newlyappointed as directors who are Audit & Supervisory Committee members after retiring as Audit & Supervisory Board members at the conclusion of the 69th Ordinary General Meeting of Shareholders. Accordingly, in presenting the compensation of recipients for these officers, the portion for their time as Audit & Supervisory Board members is included in Audit & Supervisory Board members and the portion for their time as directors who are Audit & Supervisory Committee members in Directors (Audit &supervisory committee member).
The Compensation of fiscal year ended March 2023, includes 4 directors (including 1 outside director) and 4 Audit & Supervisory Board members (including 3 outside Audit & Supervisory Board members) who retired at the conclusion of the 69th Ordinary General Meeting of Shareholders held in June 2022, as their terms of office had ended. Of these, 3 Audit & Supervisory Board members (including two outside Audit & Supervisory Board members) were newly appointed as directors who are Audit & Supervisory Committee members after retiring as Audit & Supervisory Board members at the conclusion of the 69th Ordinary General Meeting of Shareholders. Accordingly, in presenting the compensation of recipients for these officers, the portion for their time as Audit & Supervisory Board members is included in Audit & Supervisory Board members and the portion for their time as directors who are Audit & Supervisory Committee members in Directors (Audit & Supervisory committee member).
■Compliance (Non-consolidated)
Please scroll horizontally to look at table below.
Sustainability
- Message from the President
- Sustainability Management
- Stakeholder Engagement
- Corporate Value Creation Process
- Materiality (important issues)
- Environment
- Promoting Environmental Management
- Measures to Combat Global Warming
- Environmentally Friendly Products and Services
- Measures to Combat Global Warming during Business Activities
- Greenhouse Gas Emissions Report
- Conserving Biodiversity
- Resource Recycling
- Control of Chemical Substances
- Climate-related financial disclosures based on the TCFD Recommendations
- Nature-related financial disclosures based on the TNFD Recommendations
- Environment Data (ESG Data)
- External Recognition for Environmental Initiatives
- Social
- Governance
Fair and Transparent Management - ESG Data
- External Recognition
- ESPEC Programs and SDGs
- ESPEC Foundation for Global Environment Research and Technology
- Sustainability Sitemap
Social
■Number of Employees*
Please scroll horizontally to look at table below.
Employee-related Data(Non-consolidated)
Please scroll horizontally to look at table below.
■Diversity Data(Non-consolidated)
Please scroll horizontally to look at table below.
■Utilization of Childcare Leave and Shortened Working Hour Programs(Non-consolidated)
Please scroll horizontally to look at table below.
■Investment in Employee Education and Development(Non-consolidated)
Please scroll horizontally to look at table below.
■Occupational Health and Safety(Non-consolidated)
Please scroll horizontally to look at table below.
■Number of patents held (Non-consolidated)
Please scroll horizontally to look at table below.
■Number of registrants on “Test Navi,” technical information site
Please scroll horizontally to look at table below.