


Measures to Combat Global Warming
Measures to Combat Global Warming during Business Activities
Basic Concept
Climate change resulting from global warming is expected to have a wide range of effects on the ESPEC Environmental Test Business which is our main business and on the environmental conservation business operated by ESPEC MIC. Our company recently set a long-term target for reducing greenhouse gases (GHG) by 2030. We are working for a 60% reduction in SCOPE 1+2 (in-house emissions) GHG emissions compared to FY 2019, and a 30% reduction in SCOPE 3 (indirect emissions).
This target received SBT (Science Based Targets) certification from the international SBT Initiative*.
* An international initiative that encourages firms to set scientifically-grounded targets for reducing greenhouse gas emissions so that the goals of the Paris Agreement may be achieved. Jointly managed by CDP, which is an NGO involved in environmental information disclosure, UNGC (United Nations Global Compact), WRI (World Resources Institute), and WWF (World Wide Fund for Nature).
Program Overview
We identify and calculate greenhouse gas (GHG) emissions from our own business activities (SCOPE 1 and SCOPE 2) and indirect emissions from our business activities (SCOPE 3).
In the surveys conducted by CDP* for FY2025, ESPEC received a B rating for climate change and a B- rating for water security. Furthermore, ESPEC received the highest rating--an A score--at the Supplier Engagement Ratings and was selected as a Supplier Engagement Leader for the fourth time in a row. In addition, in the FY 2025 Fluorocarbon Countermeasure Rating survey conducted by the Japan Refrigerants and Environment Conservation Organization (JRECO), ESPEC received an “A” ranking for the second year in a row. ESPEC was listed for the second consecutive year in the FY2024 Asia-Pacific Climate Leaders survey conducted in partnership with the Financial Times in the UK and German data provider Statista.
* CDP is an international non-governmental organization (NGO) that surveys climate change, conservation of water resources, forest conservation, and other environmental measures taken by cities and corporations, and makes this information available to investors.

Please scroll horizontally to look at table below.

Programs for Reducing Greenhouse Gas (GHG) Emissions in Manufacturing Processes
ESPEC has been working to reduce GHG emissions in its manufacturing processes since 1996. In FY 2019, we completed the change to non-CFC foam heat insulation in all products produced at the Fukuchiyama Plant. Additionally, since FY 2022 we have been working to recover fluorocarbons left inside hoses when charging with CFC during the manufacturing process, working to prevent leaks. At the Kobe R&D Center, we switched over to renewable energy sources for air conditioning and other equipment, ceasing all use of city gas in July 2023.
Fluorocarbon Collection
Since FY 1995, we have collected fluorocarbons when performing product repairs and disposal. Based on the CFC Emissions Control Law, we are registered as a Type 1 CFC collecting business at municipalities throughout the country. All collected refrigerant CFCs are handed over to companies that can recycle CFC, and are rendered harmless through high-temperature plasma destruction at fluorocarbon destruction facilities. The recovered quantity amounts to approximately 86 tons (cumulative as of March 2025).
■ Collected quantity of fluorocarbon (Non-consolidated)
(Units:kg)
| (FY) | 2020 | 2021 | 2022 | 2023 | 2024 |
|---|---|---|---|---|---|
| Collected quantity for a single fiscal year | 3,668 | 3,208 | 3,695 | 3,471 | 3,115 |
| Collected quantity for cumulative total | 73,068 | 76,276 | 79,971 | 83,442 | 86,557 |
Initiatives in Product Transportation
We are beginning a modal shift (utilization of rail transportation) in order to prevent global warming. Starting from Osaka, we are switching from trucking to freight for long-distance transportation to destinations such as Hokkaido, Tohoku, Kyushu, and Tokyo.
Switching to renewable energy at business offices
ESPEC is actively introducing renewable energy, and completed the switch to renewable energy for power at all offices in Japan (excepting some rental properties) by the end of FY 2021. As a result, 98% of the power used (kWh) by the group in Japan is renewable energy. Solar power generating systems have been installed at the Fukuchiyama Plant (Training Center) and Kobe R&D Center (Testing Building). The amount of power generated at these two sites in FY 2024 was 61,000 kWh. We are also advancing initiatives overseas, with our U.S. Group company beginning the introduction of renewable energy in April 2025.
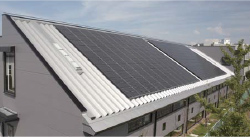 Fukuchiyama Plant Training Center (Fukuchiyama City, Kyoto Prefecture)
Commissioned testing services using 100% renewable energy
By April 2021, we had switched over to renewable energy sources for the electricity used at all five of our laboratories in Japan (Utsunomiya, Tokoname, Toyota, Kariya, Kobe). Providing Japan’s first laboratory testing services powered by 100% renewable energy sources allows us to help customers reduce their CO2 emissions under SCOPE 3 Category 1 (purchased products and services). Reports for tests conducted at our testing laboratory bear the Green Power mark, indicating that the test was performed with no CO2 emissions. This mark is equivalent to the environmental label (ISO/JISQ14021) for self-declared environmental claims “Type II” established by the International Organization for Standardization (ISO).
 Green Power mark
Efforts to reduce GHG emissions at suppliers
We have requested that our suppliers reduce SCOPE 1+2 emissions by 20% by FY 2025, and we are working with them to achieve the goal together through activities such as study sessions on how to reduce GHG emissions. We also created a supplier environmental contribution recognition program in June 2025 to recognize suppliers that have reduced their GHG emissions and suppliers who have received SBT certification. In recognition of these efforts, we were given the highest rating—an A score—at the FY 2024 Supplier Engagement Ratings conducted by CDP, and were selected for the third year in a row as a Supplier Engagement Leader.
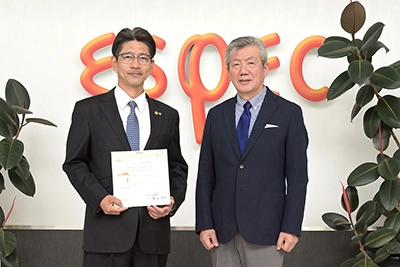 3rd Award Ceremony for Suppliers’ Environmental Contributions
Climate-related financial disclosures based on the TCFD Recommendations
ESPEC has expressed its support for the proposal of the Task Force on Climate-related Financial Disclosures (TCFD)*, which aims to promote the investigation and disclosure of the financial implications of the risks and opportunities posed by climate change. We are disclosing information related to climate change based on the four themes recommended by TCFD: governance, strategy, risk management, and metrics and targets.
*Task Force on Climate-related Financial Disclosures
Established in 2015 by the Financial Stability Board (FSB).
Nature-related financial disclosures based on the TNFD Recommendations
We support the recommendations of the Taskforce on Nature-related Financial Disclosures (TNFD),which seeks to identify and disclose dependencies and impacts on natural capital, as well as the associated risks and opportunities. Guided by the four themes recommended by the TNFD—“Governance,” “Strategy,” “Risk and Impact Management,” and “Metrics and Targets”—we have prepared our TNFD Report.
Initiatives in Which We Are Taking Part
● Task Force on Climate-related Financial Disclosures (TCFD)
In December 2021, we expressed our support for the proposal of the Task Force on Climate-related Financial Disclosures (TCFD). We also participate in the TCFD Consortium, which consists of companies and financial institutions that support the TCFD proposal.


● Task Force on Nature-related Financial Disclosures (TNFD)
In September 2025, we expressed our support for the proposal of the Task Force on Nature-related Financial Disclosures.
![]()
● Japan Climate Initiative (JCI)
Since January 2019, we have taken part in the Japan Climate Initiative (JCI),* which is a network of companies and local governments working to combat climate change.
- ※Japan Climate Initiative. Established in 2018.
Changes in the Amounts of Energy Used (Consolidated)
Please scroll horizontally to look at table below.
| (Fiscal year) | 2020 | 2021 | 2022 | 2023* | 2024 | |
|---|---|---|---|---|---|---|
| Gasoline | 519㎘ | 528㎘ | 555㎘ | 540㎘ | 555㎘ | |
| Kerosene | - | - | 0㎘ | 0㎘ | 0㎘ | |
| Diesel fuel | 39㎘ | 7㎘ | 7㎘ | 6㎘ | 19㎘ | |
| LPG | 1t | 0t | 0t | 0t | 3t | |
| City gas | 127,000 Nm³ |
110,000 Nm³ |
90,000 Nm³ |
73,000 Nm³ |
74,000 Nm³ |
|
| Natural gas | 166,000 Nm³ |
163,000 Nm³ |
167,000 Nm³ |
147,000 Nm³ |
252,000 Nm³ |
|
| Electricity | 23,112,000 kWh |
25,414,000 kWh |
24,913,000 kWh |
27,987,000 kWh |
30,733,000 kWh |
|
| Amount of the above obtained from renewable energy (including in-house solar power generation, Renewable Energy Certificate power, and the Renewable Energy Power Menu) |
4,374,000 kWh |
17,717,000 kWh |
18,124,000 kWh |
20,266,000 kWh |
20,724,000 kWh |
|
* Excluding Cosmopia Hightech Corp., which was made a consolidated company in August 2023.
Changes in Breakdown of Electricity Use (Consolidated)
Please scroll horizontally to look at table below.
(Units:1,000kWh)
| (Fiscal year) | 2020 | 2021 | 2022 | 2023* | 2024 | |
|---|---|---|---|---|---|---|
| Purchased electrical power | 23,020 | 25,334 | 24,824 | 27,934 | 30,675 | |
| Amount of the above obtained from renewable energy (including in-house solar power generation, Renewable Energy Certificate power, and the Renewable Energy Power Menu) |
4,282 | 17,636 | 18,035 | 20,213 | 20,666 | |
| Private power generation (Solar power generation) |
99 | 84 | 94 | 60 | 61 | |
| Power used | 23,112 | 25,414 | 24,913 | 27,987 | 30,733 | |
| Amount of the above obtained from renewable energy (including in-house solar power generation, Renewable Energy Certificate power, and the Renewable Energy Power Menu) |
4,374 | 17,717 | 18,124 | 20,266 | 20,724 | |
* Excluding Cosmopia Hightech Corp., which was made a consolidated company in August 2023.
Sustainability
- Message from the President
- Sustainability Management
- Stakeholder Engagement
- Corporate Value Creation Process
- Materiality (important issues)
- Environment
- Promoting Environmental Management
- Measures to Combat Global Warming
- Environmentally Friendly Products and Services
- Measures to Combat Global Warming during Business Activities
- Greenhouse Gas Emissions Report
- Conserving Biodiversity
- Resource Recycling
- Control of Chemical Substances
- Climate-related financial disclosures based on the TCFD Recommendations
- Nature-related financial disclosures based on the TNFD Recommendations
- Environment Data (ESG Data)
- External Recognition for Environmental Initiatives
- Social
- Governance
Fair and Transparent Management - ESG Data
- External Recognition
- ESPEC Programs and SDGs
- ESPEC Foundation for Global Environment Research and Technology
- Sustainability Sitemap